Usage
Basic usage of the HistColorbar class and histcolorbar function is
shown on the index page of the documentation.
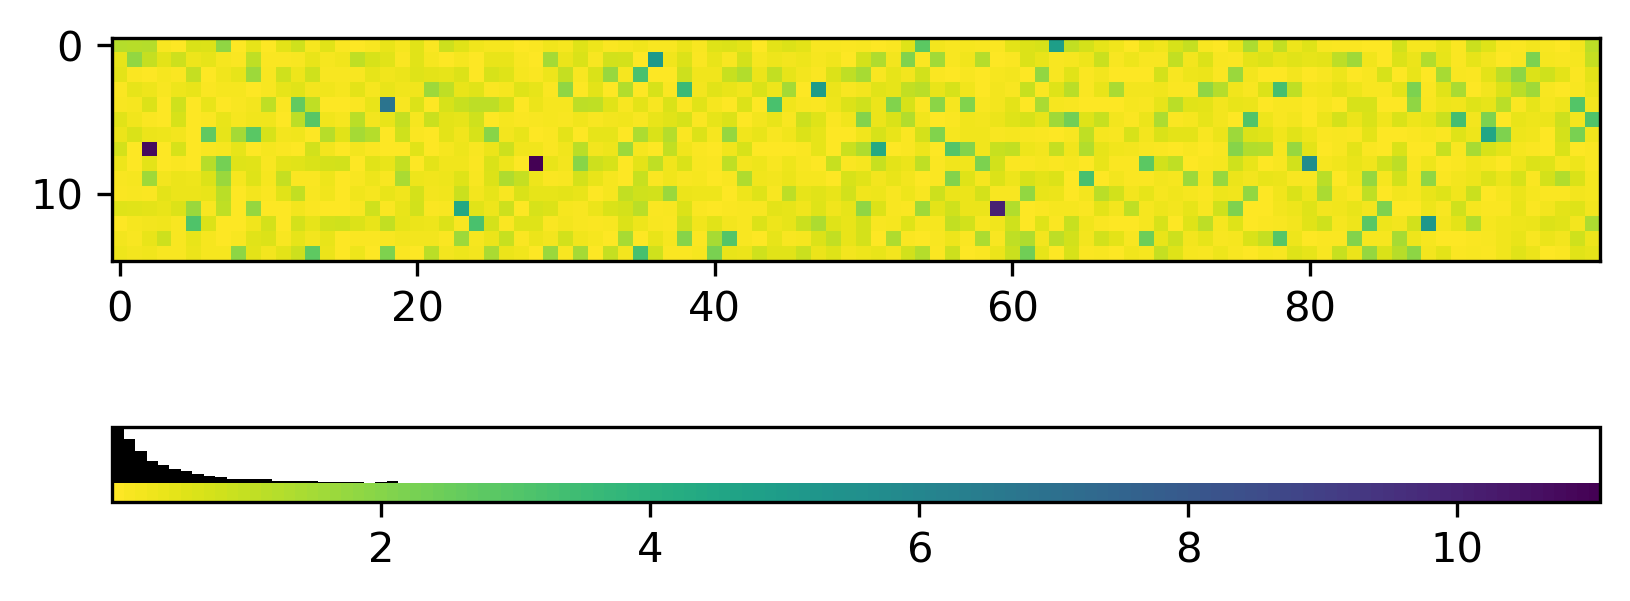
By default, the HistColorbar class will draw a histogram using the mappable’s
colormap. If the histogram is heavily weighted, it may be hard to see the full
spectrum of the colormap.
import numpy as np
import matplotlib.pyplot as plt
from mpl_histcolorbar import histcolorbar

# Generate some data
rng = np.random.default_rng(seed=42)
data = rng.pareto(a=3, size=(15, 100))

# Plot an image
fig, ax = plt.subplots()
im = ax.imshow(data, cmap='viridis_r')

# Add the HistColorbar
hcb = histcolorbar(fig, im, location="bottom")

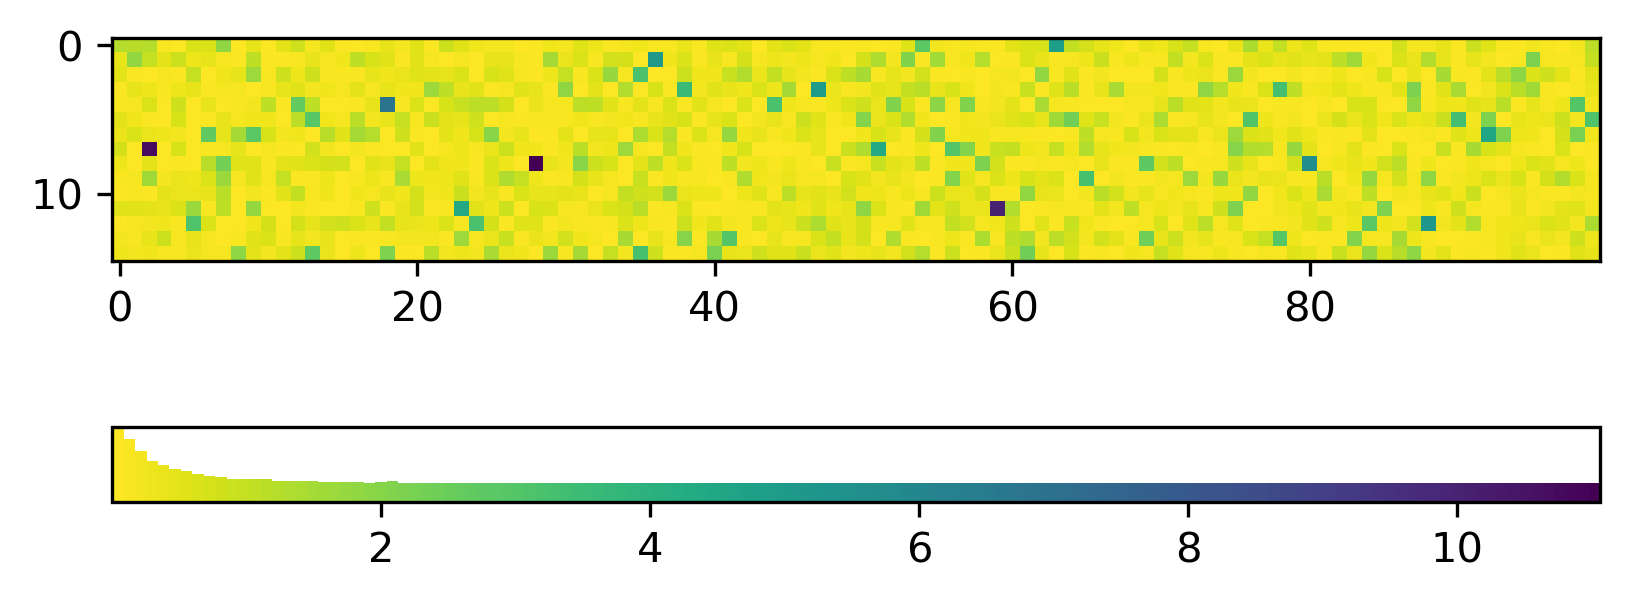
To still see the full colormap in the histcolorbar, you can call
HistColorbar with the separate_hist=True keyword argument.
This will draw the histogram on top of a traditional colorbar. The
relative scale of the histogram and colorbar in the histcolorbar can be adjusted with
the hist_fraction keyword argument. The default value is 0.5:
import numpy as np
import matplotlib.pyplot as plt
from mpl_histcolorbar import histcolorbar

# Generate some data
rng = np.random.default_rng(seed=42)
data = rng.pareto(a=3, size=(15, 100))

# Plot an image
fig, ax = plt.subplots()
im = ax.imshow(data, cmap='viridis_r')

# Add the HistColorbar
hcb = histcolorbar(fig, im, location="bottom", separate_hist=True, hist_fraction=0.75)
To better distinguish between the histogram and colorbar parts of the histcolorbar, an arbitrary solid color can be chosen for the histogram:
import numpy as np
import matplotlib.pyplot as plt
from mpl_histcolorbar import histcolorbar

# Generate some data
rng = np.random.default_rng(seed=42)
data = rng.pareto(a=3, size=(15, 100))

# Plot an image
fig, ax = plt.subplots()
im = ax.imshow(data, cmap='viridis_r')

# Add the HistColorbar
hcb = histcolorbar(fig, im, location="bottom", separate_hist=True,
                   hist_fraction=0.75, hist_color="black")